
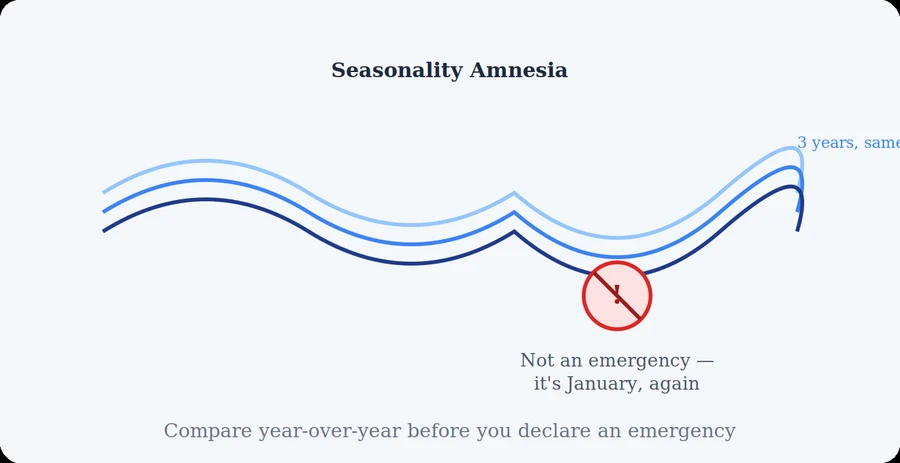
Sales dropped 22% in January. The panic begins. Budgets get slashed, the agency gets a stern email, campaigns that took months to stabilize are torn apart. Then someone finally pulls last January’s numbers and discovers the business dropped 24% that year too — and the year before. Nothing was broken. The team just declared an emergency over a pattern that repeats every single year.
What Is Seasonality Amnesia?
Seasonality Amnesia is one of the most expensive forms of misreading data, because it triggers action at precisely the wrong time. Comparing this month to last month feels intuitive, but for most businesses it compares two entirely different demand environments — different holidays, weather, payroll cycles, buying intent. You end up killing your winners in the slow season and congratulating yourself for tailwinds in the busy one. It’s the same trap as Tip #8’s Attribution Delusion — a number that looks precise and urgent can still be telling you nothing meaningful.
How to Build a Seasonality Baseline
To stop reacting to the calendar:
- Compare Year-over-Year First: Month-over-month tells you what changed recently; year-over-year tells you whether that change actually means anything.
- Build a Seasonality Baseline: Chart at least two or three years of monthly performance. Once you can see the shape of your year, “bad months” become expected months. This is exactly the kind of rigor missing from the panic-driven decisions we warned about in Tip #9’s Sunk Cost Cemetery — except here the emotional trigger isn’t a sunk cost, it’s an unearned sense of urgency.
- Set Expectations Before the Dip: Tell stakeholders in November what December and January will look like. A predicted decline is a forecast; an unpredicted one is a crisis. Documenting this ahead of time is the same discipline behind logging shortcuts in Tip #18’s Marketing Debt — write it down before it becomes a fire drill.
Why You Should Set Expectations Before the Dip
Most marketing emergencies aren’t emergencies. They’re the same month arriving on schedule and finding everyone with a short memory. And just like a test result that wouldn’t change your Monday, as we covered in Tip #17’s Testing Theater Trap, a dip that matches every prior year shouldn’t change your Monday either.
#digital_marketing_strategy_tips
FAQ
Q: How many years of data do I need before I can trust a seasonality baseline?
A: Two years gives you a rough shape; three or more lets you separate genuine seasonality from a one-off event (a bad year, a competitor’s promotion, an algorithm change). If you only have one year of data, treat any month-over-month dip with extra caution rather than full confidence either way.
Q: What if this year’s dip is bigger than the historical pattern?
A: That’s exactly when year-over-year comparison earns its keep — a 22% drop that’s normally 10% at this time of year is a real signal worth investigating, while a 22% drop that’s normally 24% is noise. The baseline doesn’t tell you nothing is ever wrong; it tells you what “normal wrong” looks like so you can spot “abnormal wrong.”
Q: We’re a newer business without years of historical data. What do we do?
A: Look at industry or category-level seasonality data as a rough proxy (e.g. general retail dips in January, B2B software slows around major holidays), and treat your own first year as the baseline you’ll compare against going forward. Flag internally that any current-year conclusions are provisional until you have a second year to check against.
Q: How do I convince leadership not to panic during a seasonal dip if they don’t know the history?
A: Show the chart, not just the argument. A simple 2-3 year overlay of the same months side by side is far more convincing than a verbal explanation — seeing the same dip repeat visually removes the emotional urgency almost instantly.
Final Thought
Before you sound the alarm on a bad month, pull up the same month from last year and the year before. If the pattern repeats, you haven’t found a crisis — you’ve found the calendar doing exactly what it always does.
Let’s Build Your Seasonality Baseline
We chart your historical performance so you know which dips are normal and which ones need real attention.